Every metric, one dashboard
Revenue, ADR, occupancy, RevPAR, bookings, cancellations, and reviews — all in one place, no spreadsheets required.
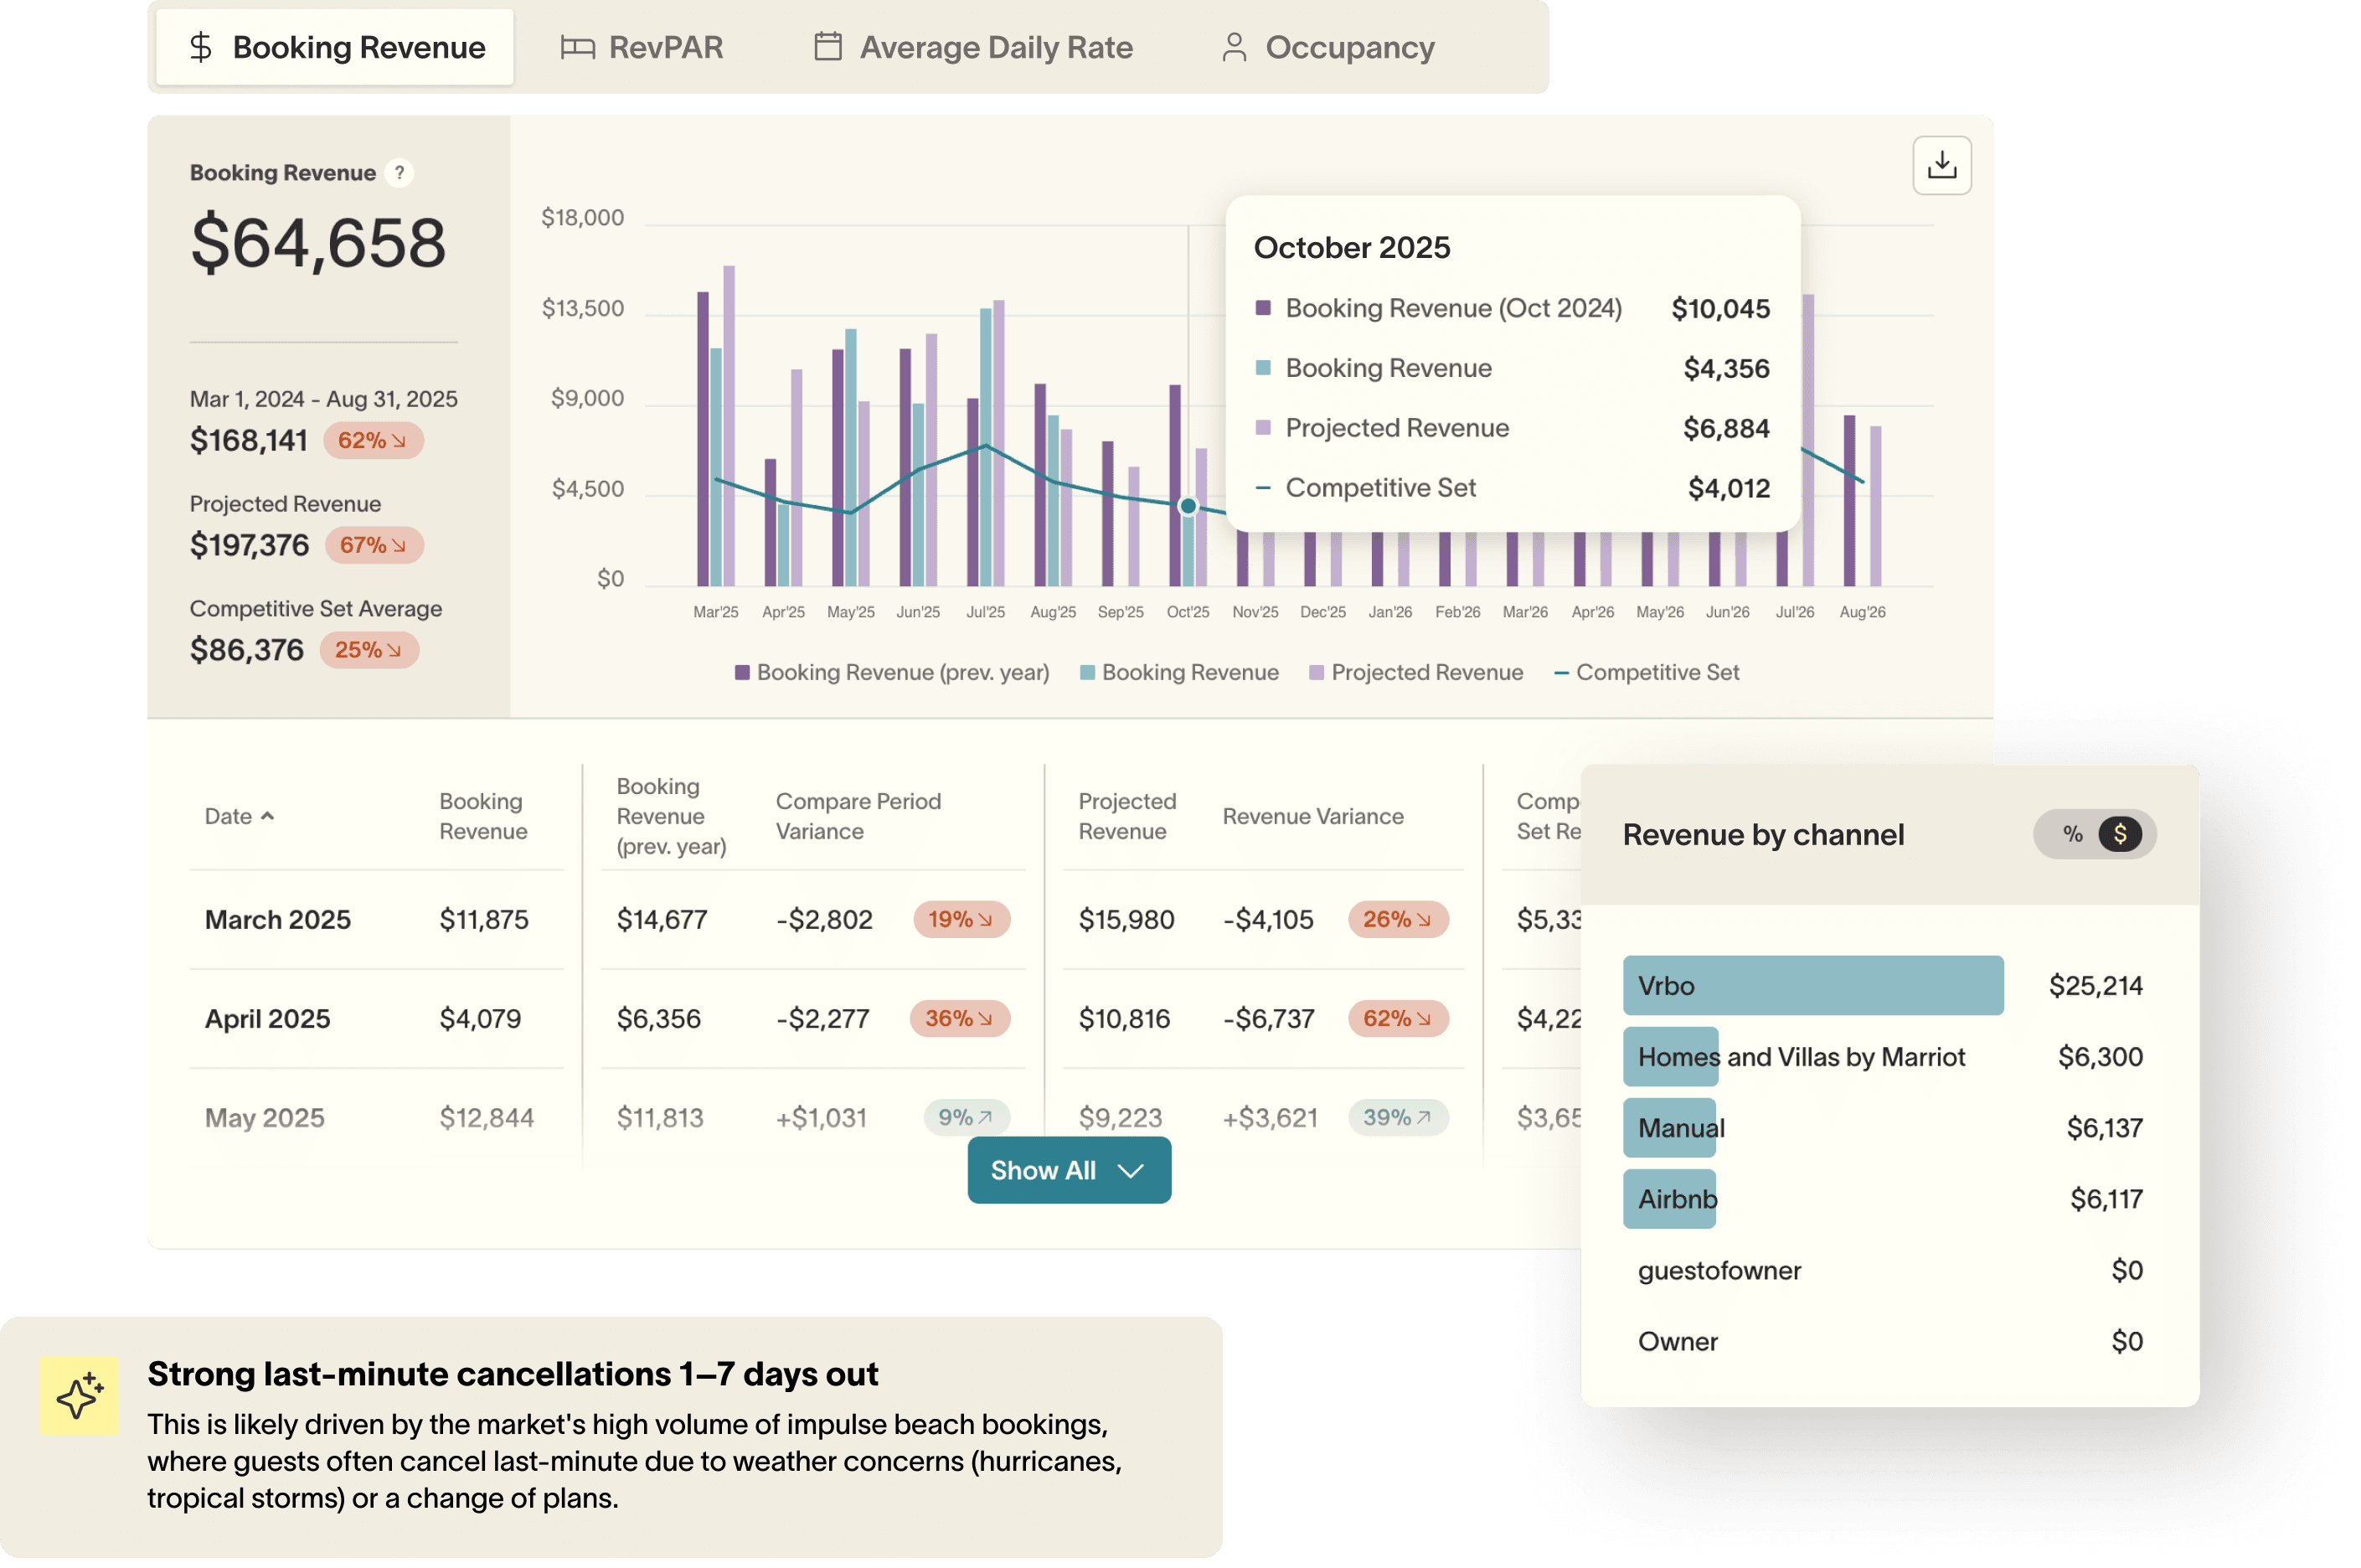
Performance in context, not just in isolation
Compare actuals against your previous year, revenue projection, and comp set average — all on the same graph.
Built for your owners too
Generate a branded PDF owner report for any property and any date range in seconds, without the manual work.
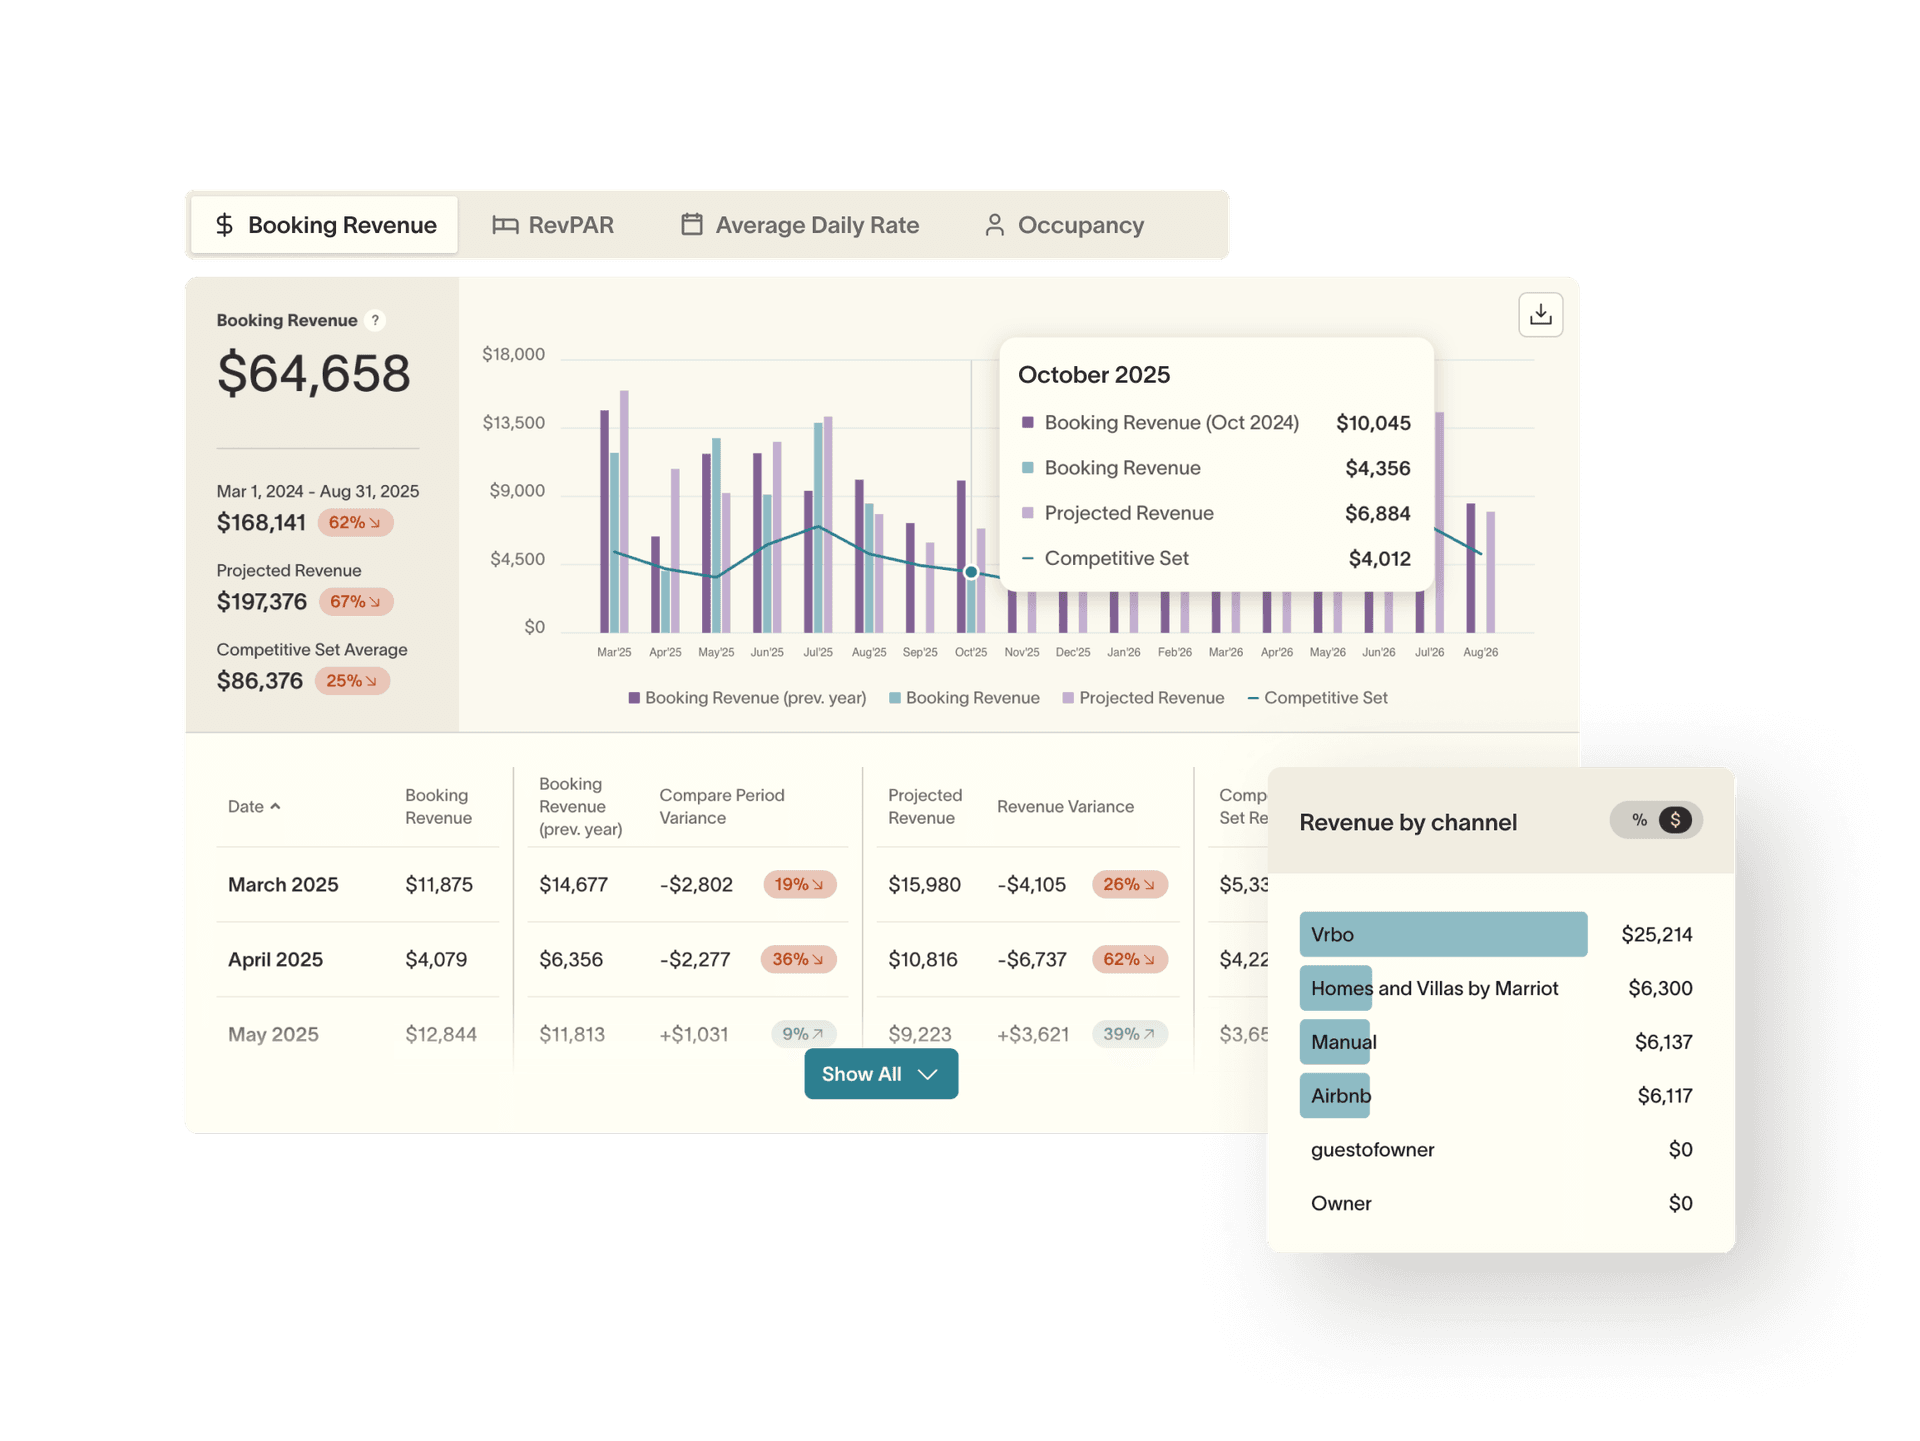
Revenue & Core Metrics
Track your key revenue metrics against what actually matters.
Revenue & Core Metrics
Track your key revenue metrics against what actually matters.
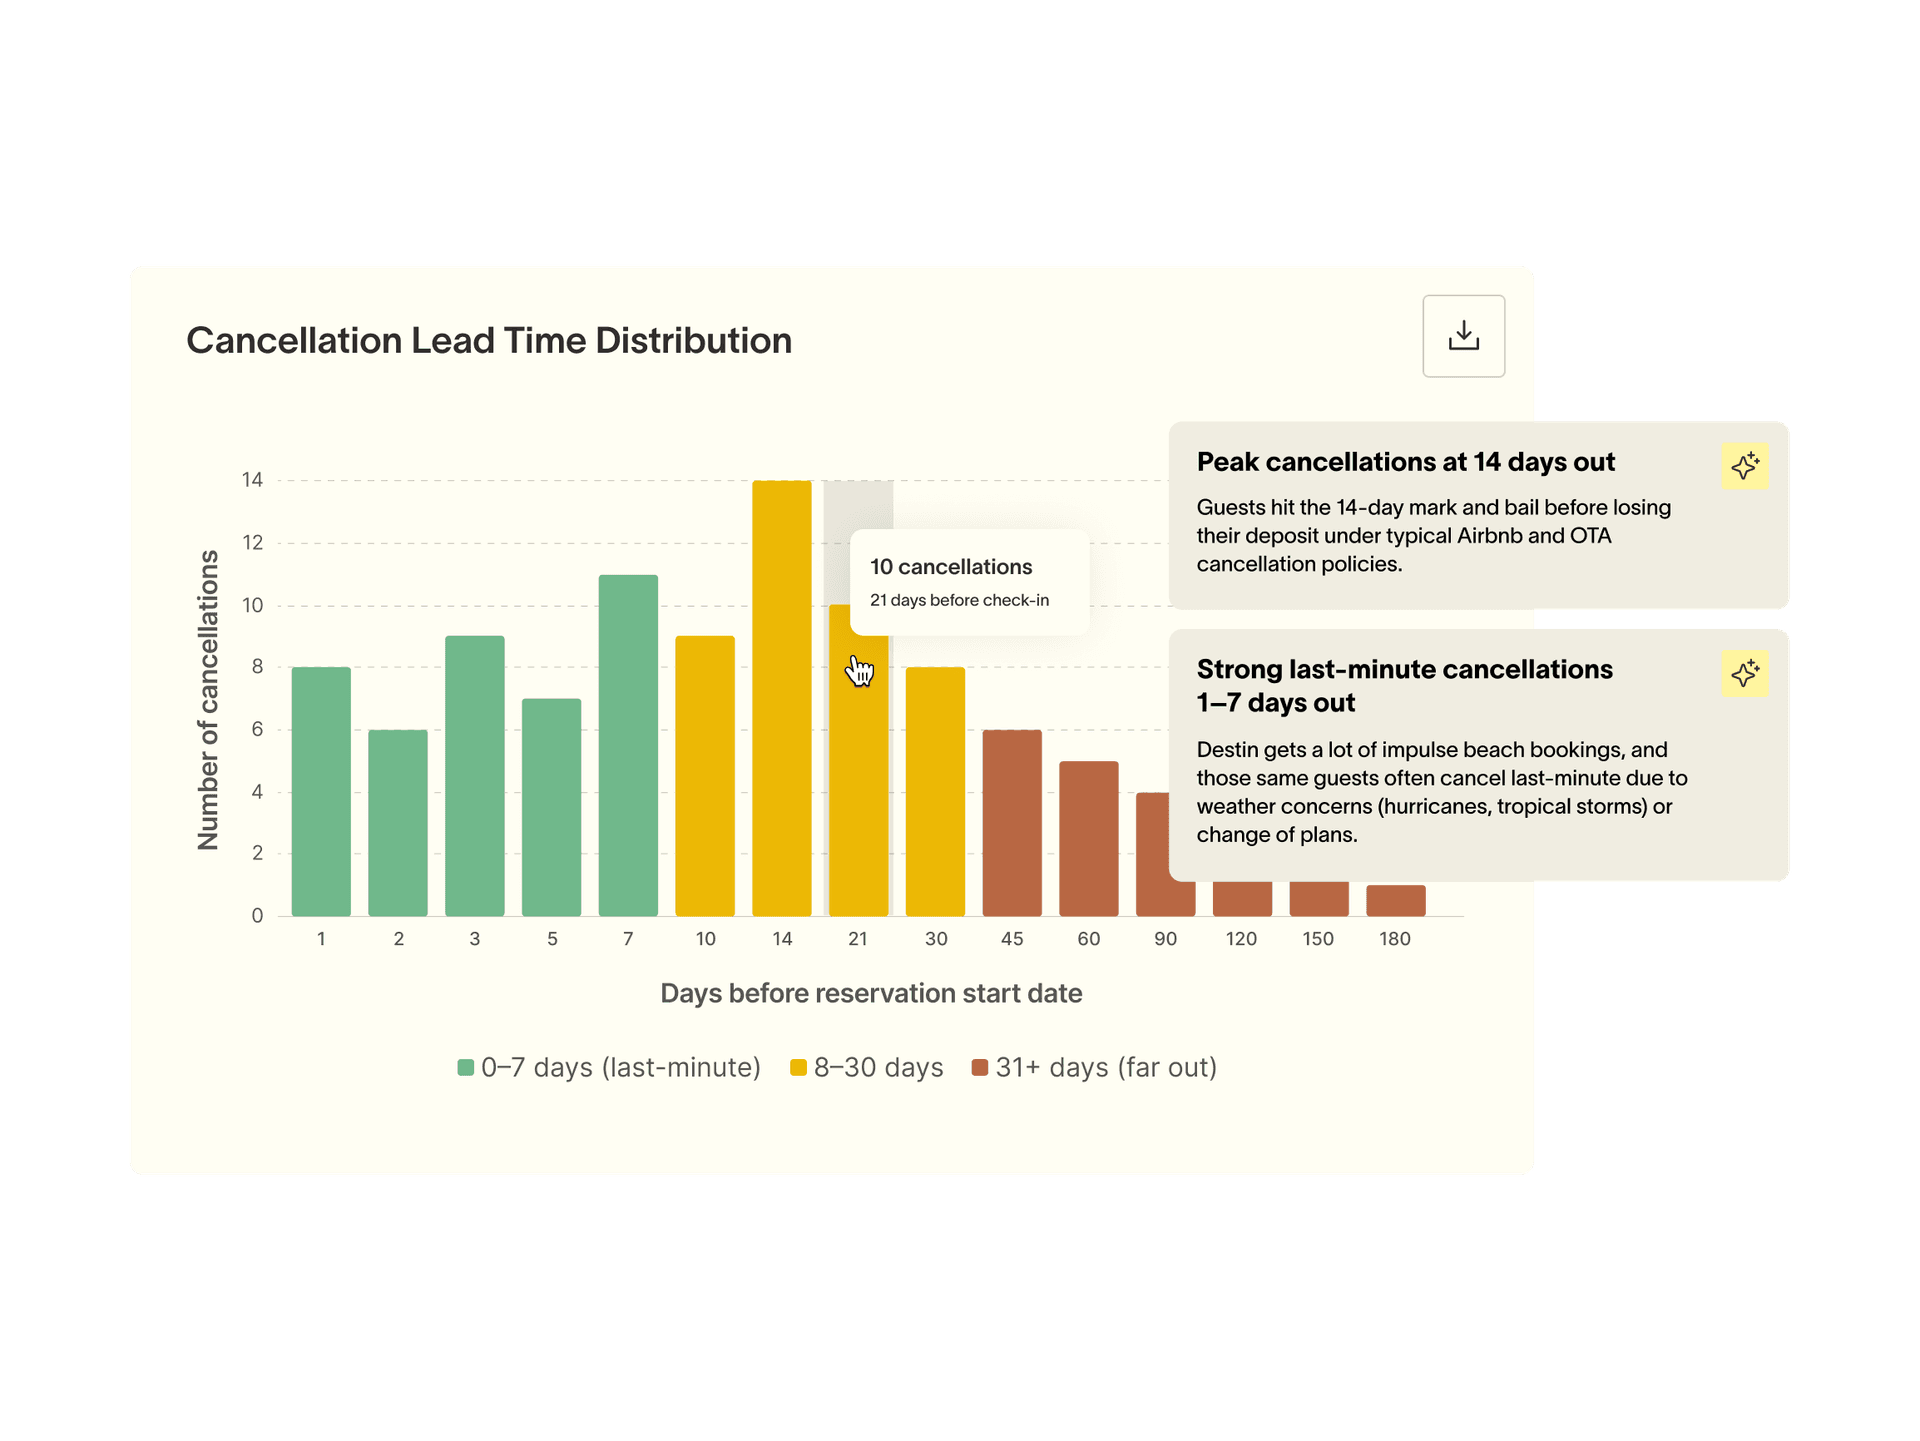
Bookings & Availability
Understand what's filling your calendar and what isn't.
Bookings & Availability
Understand what's filling your calendar and what isn't.
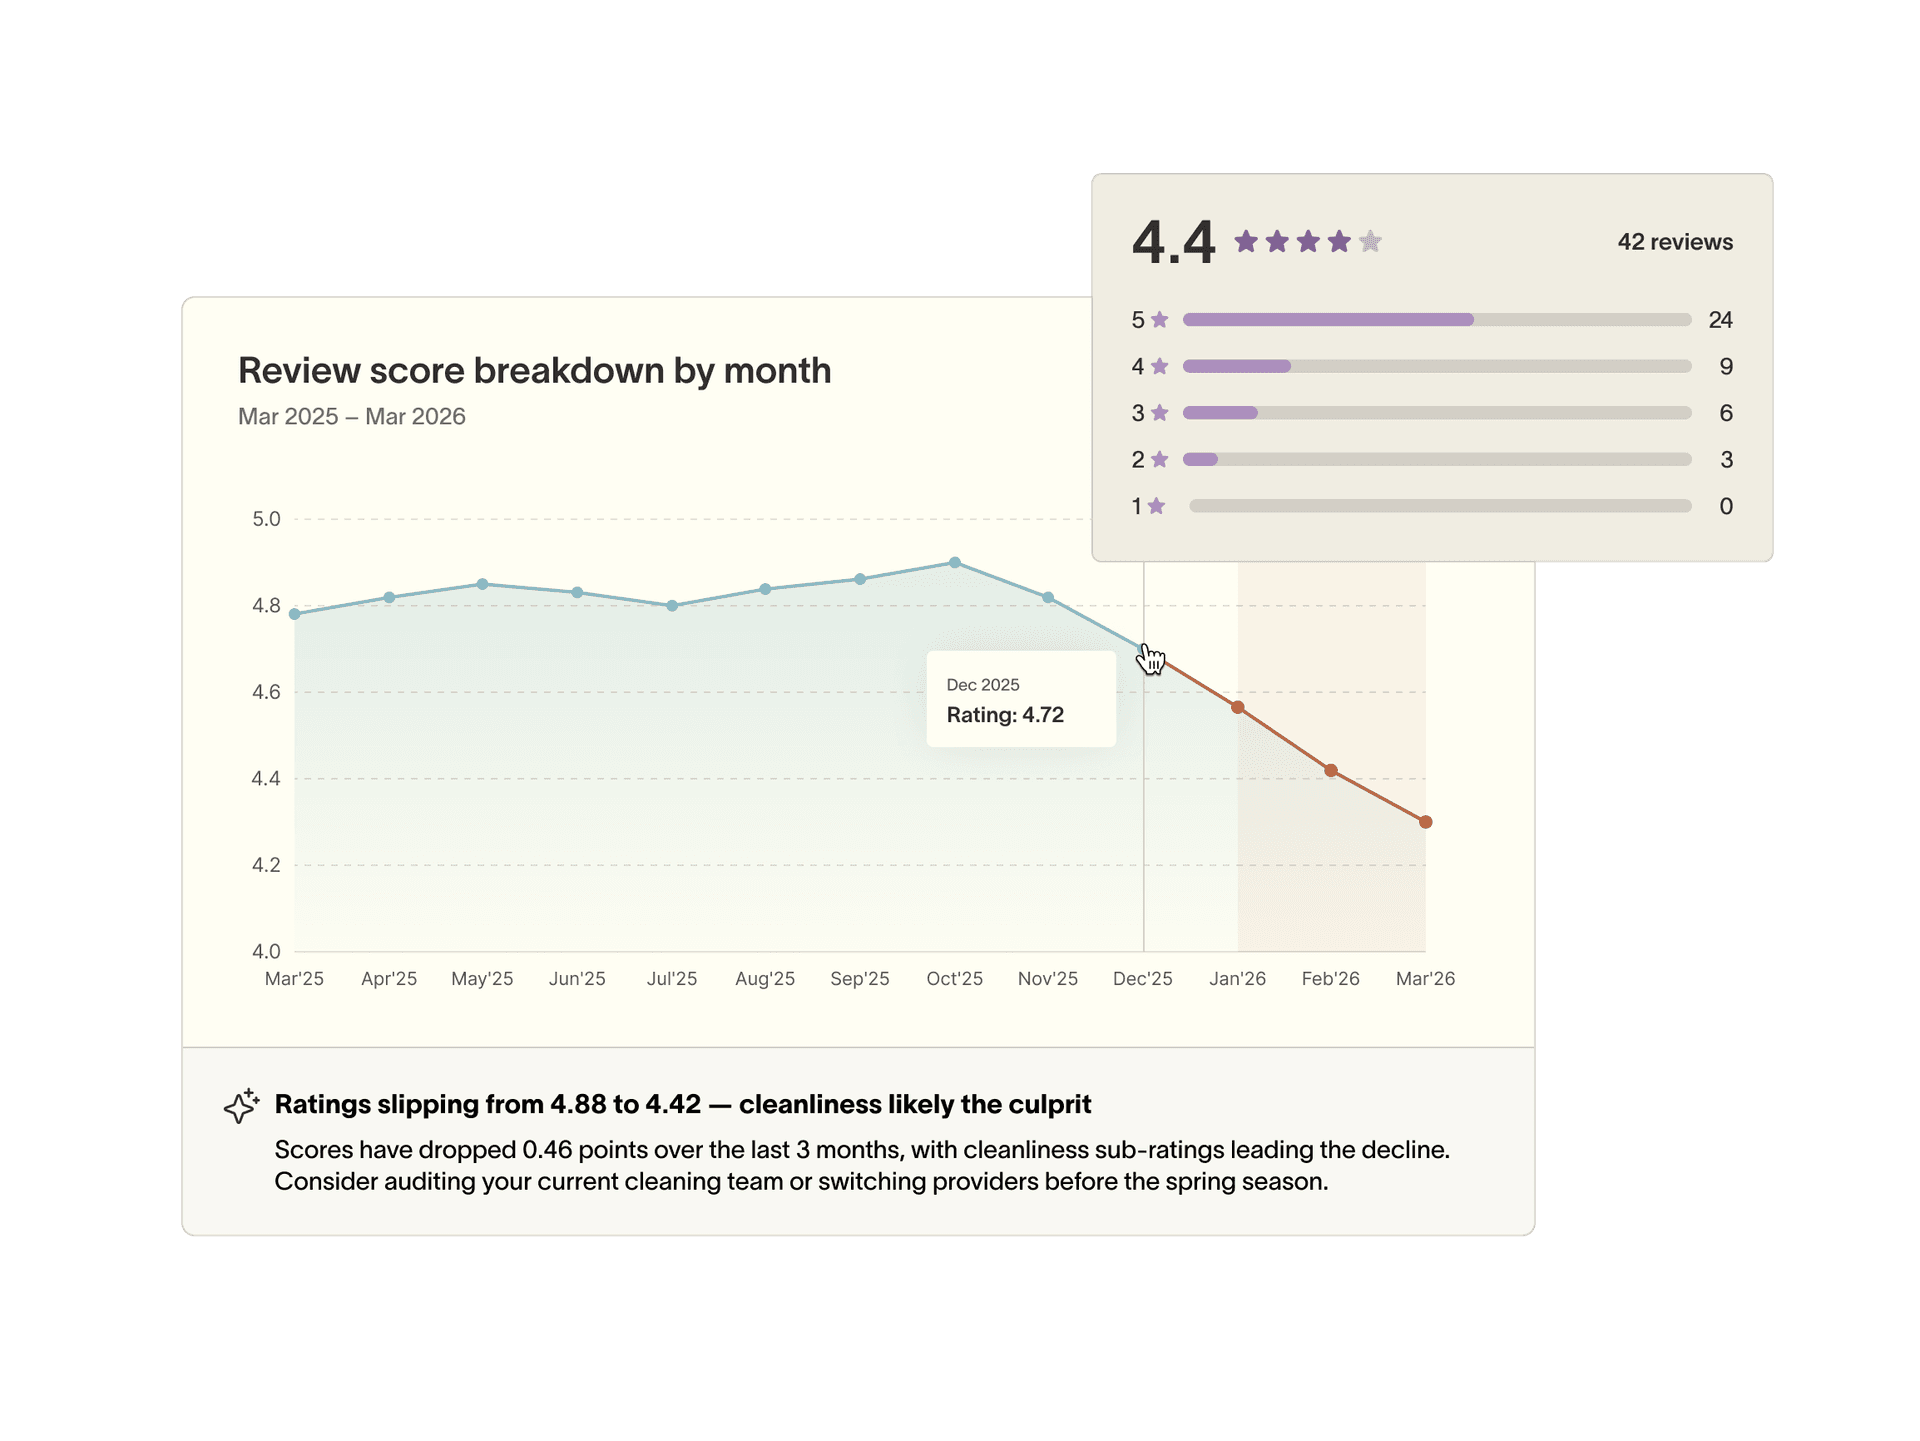
Guest Reviews
Everything your guests are saying, in one place.
Guest Reviews
Everything your guests are saying, in one place.
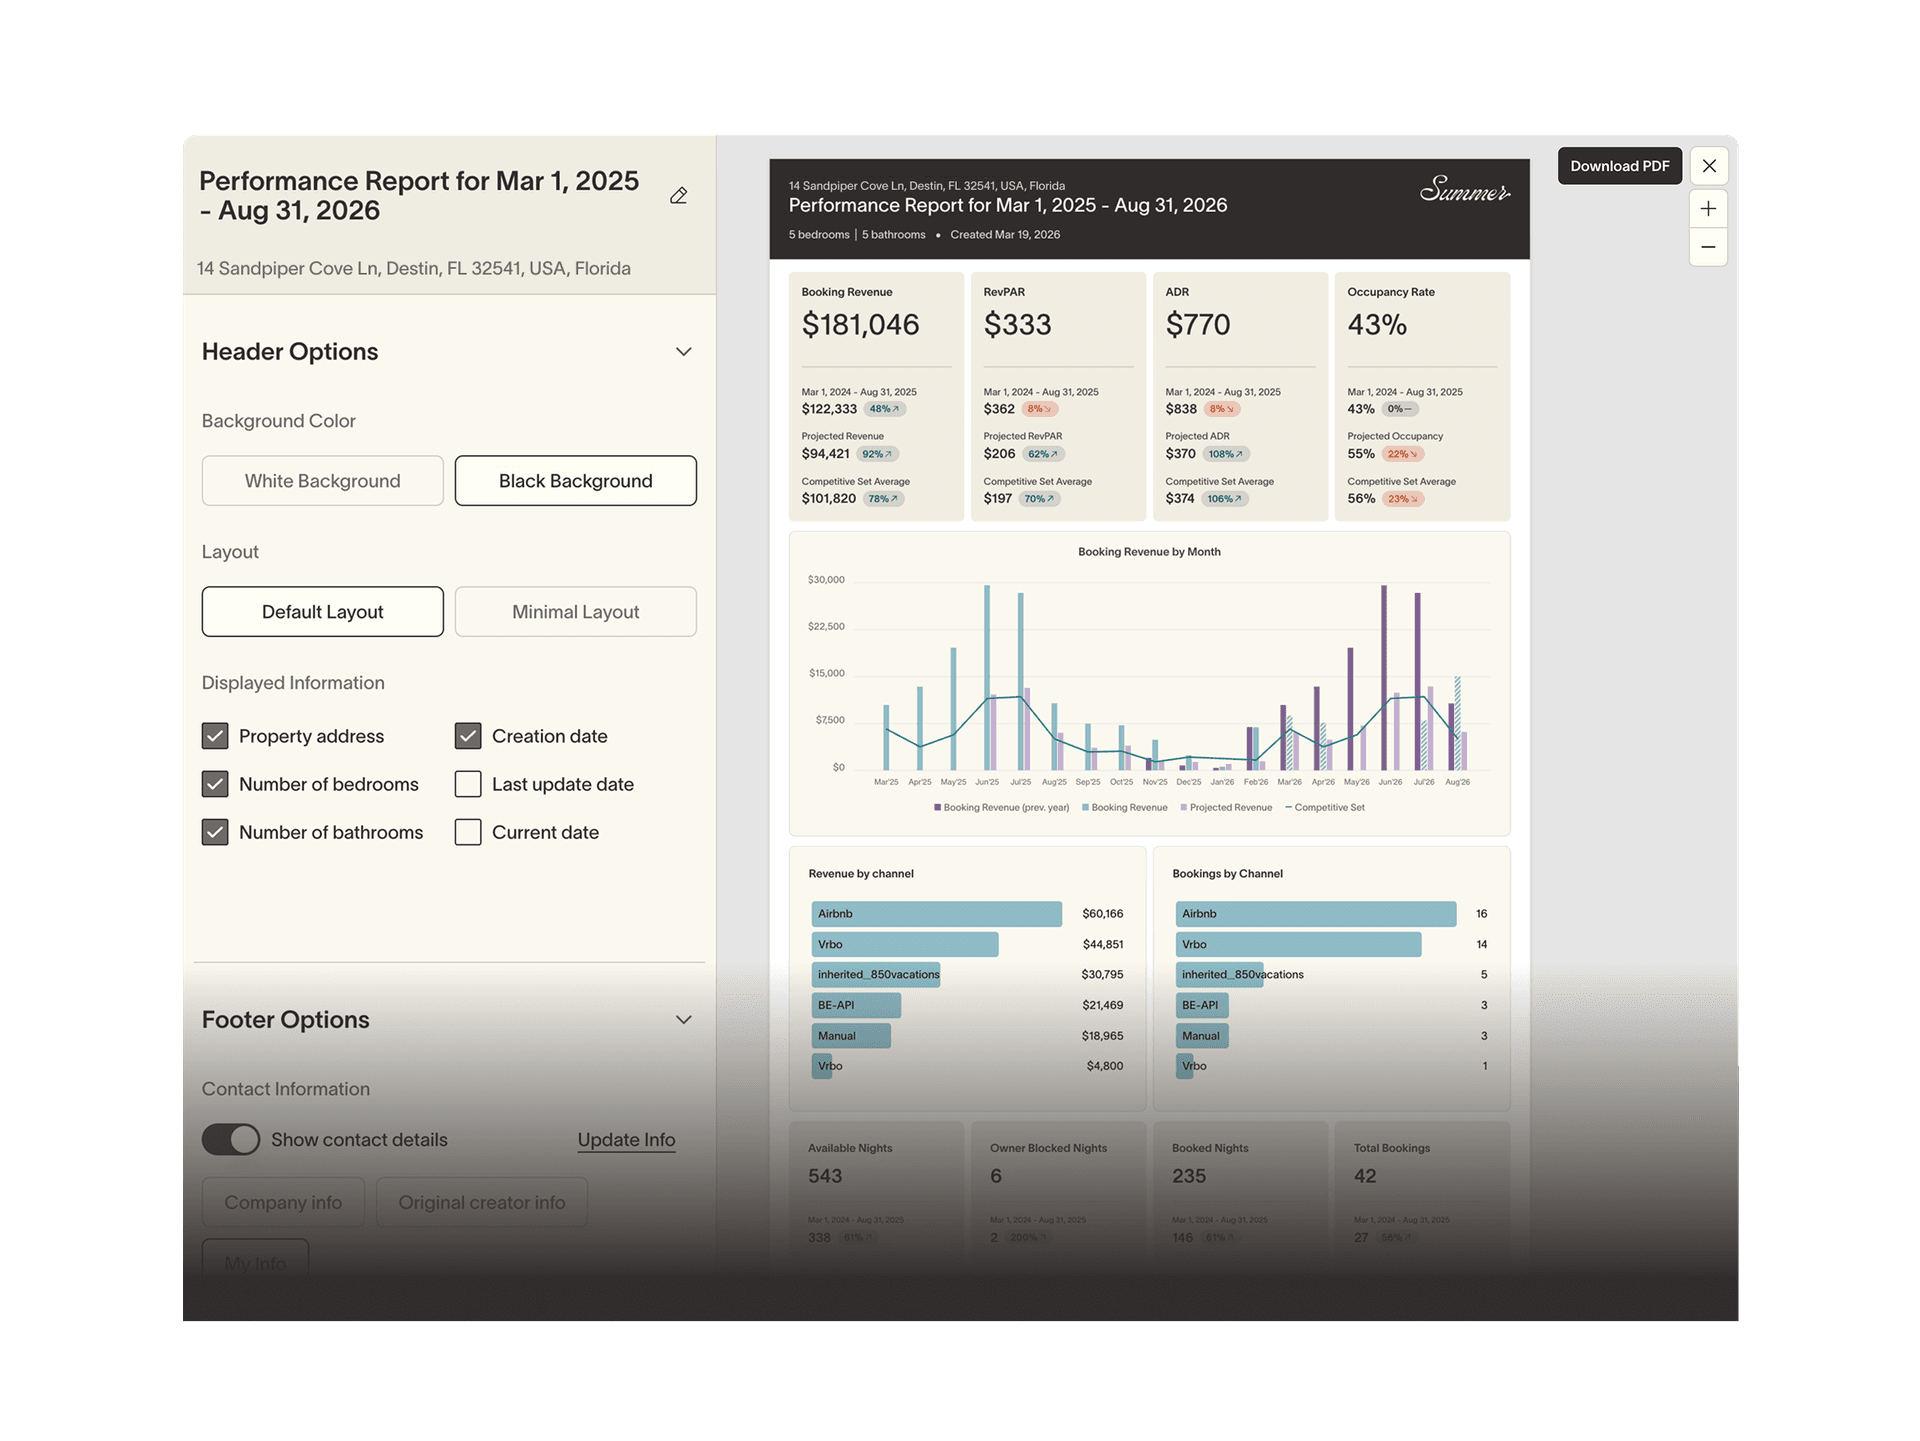
Owner Reporting
Professional owner reports, without the manual work.
Owner Reporting
Professional owner reports, without the manual work.

“As a Casago franchise owner, I need tools that help me make decisions quickly and confidently. SummerOS gives me that. I can see performance across every property, build custom projections, and benchmark against the market without touching a spreadsheet. It’s made our reporting cleaner, faster, and a lot more impressive for owners.”
Tim Smith, Owner & Operator at Casago New Smyrna Beach and Daytona Beach

FAQ
Stop looking back.
Start getting ahead.
Join the operators using performance benchmarks to make faster, smarter decisions.